Overview
Assets catalog
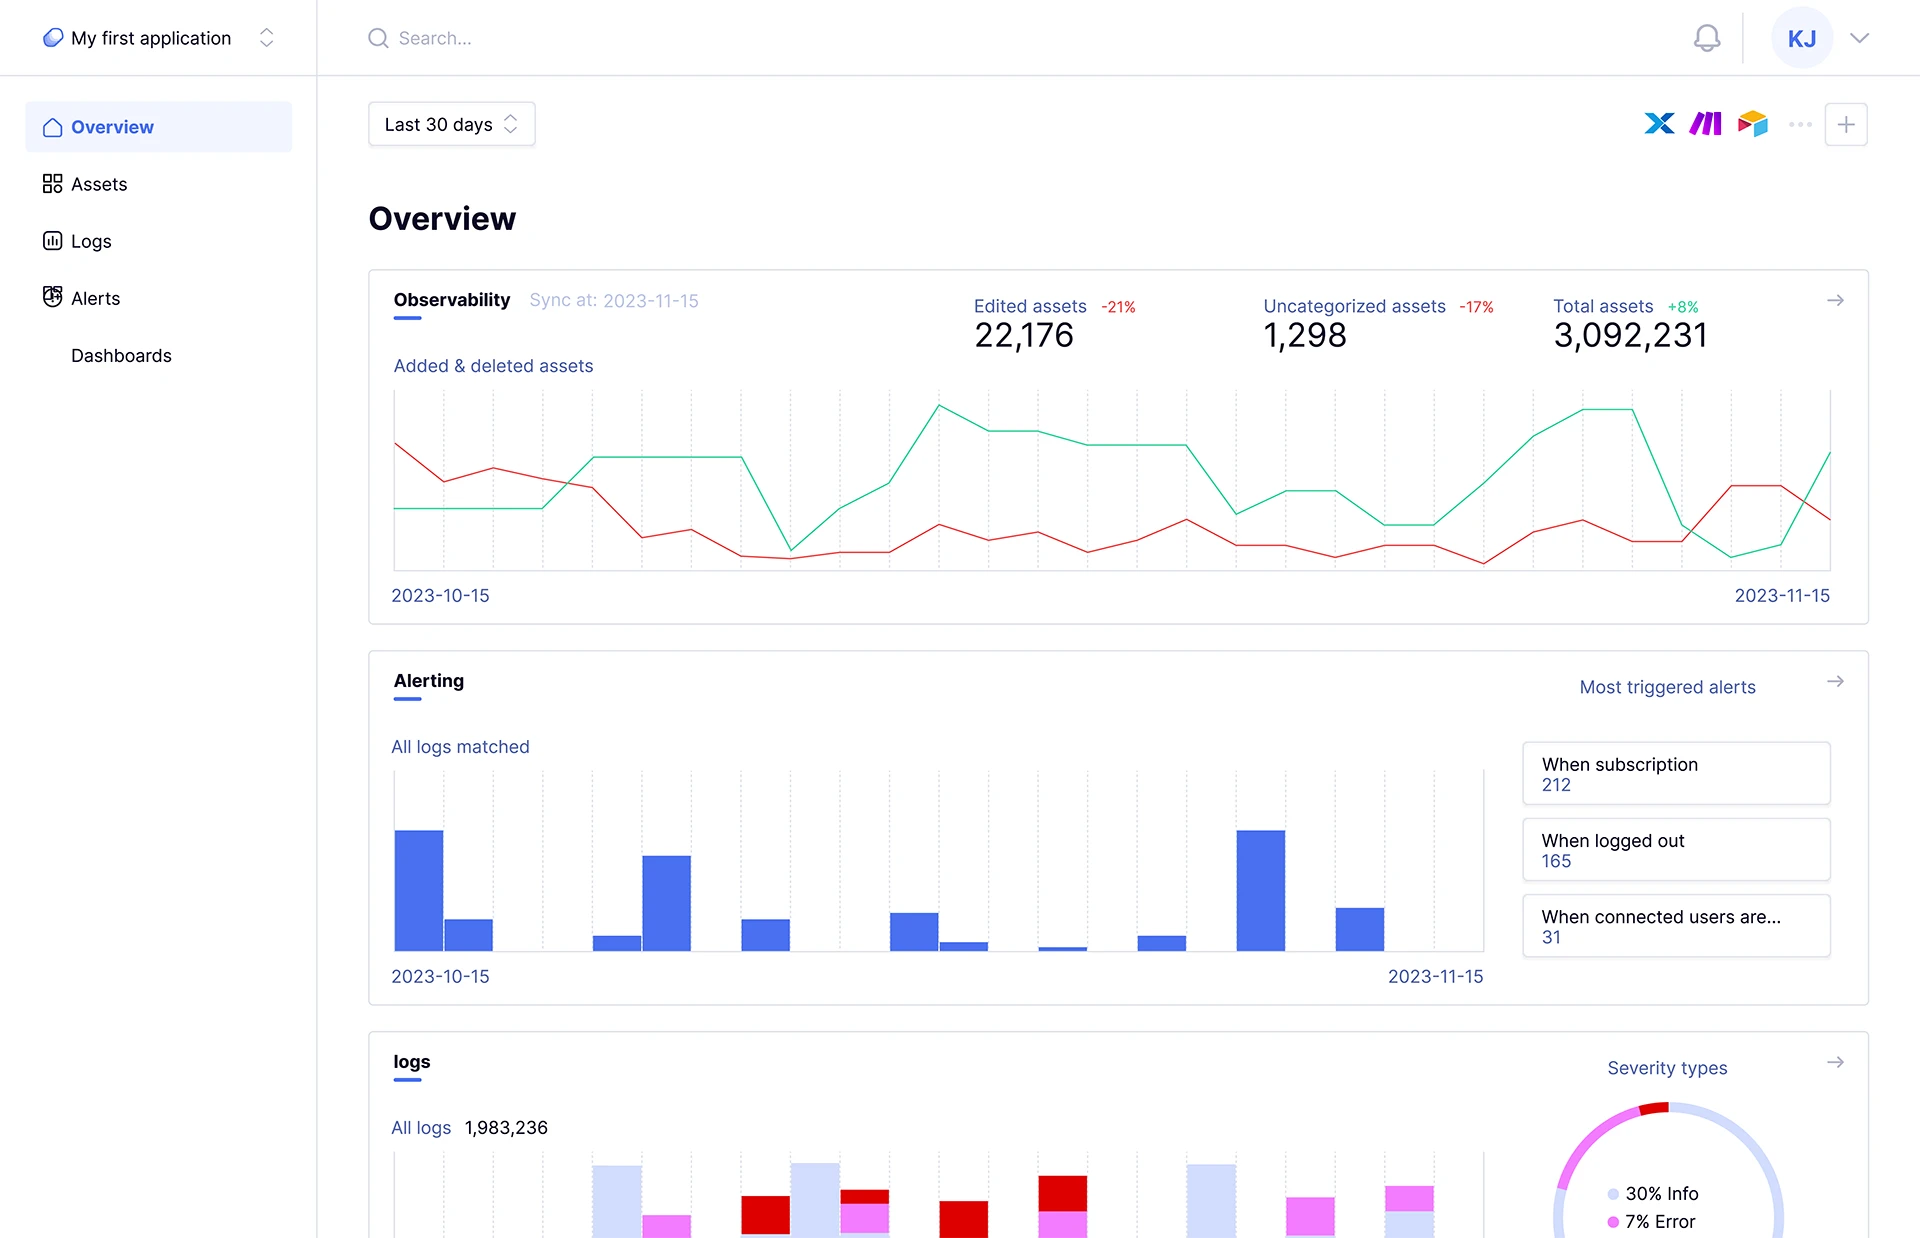
With the Assets Catalog chart provided on the overview page, you can track changes in your assets, such as the number of assets that have been modified, added, and deleted.
Alerting
The alerting graph provides insights into the number of logs that have triggered at least one of your previously configured alerts. It also highlights the most frequently used alert.
Logs are crucial data for an application, which is why you’ll find a chart here that provides an overview of the total number of logs ingested in the selected time period, as well as the number of logs per day (or per hour for the “today” and “yesterday” time ranges) grouped by severities.
When you see red, it’s time to dive in and take action! 😉
Features
Every key feature to easily monitor your stack.
